Integrate seamlessly with a variety of data sources and formats
Redefine Your Data Analytics
with Conversational AI
Redefine Your Data Analytics with Conversational AI
Effortless Data Analysis, Simplified Collaboration, and Real-Time Insights
through natural language, making complex data analysis accessible to those
without technical expertise

Seamless
Integration with
Popular Data
Sources
Powerful Data Analysis at Your Fingertips
Our platform is designed to help you seamlessly connect, analyze, and visualize your data—without
the hassle. Whether you’re pulling data from multiple sources or uploading your files, we provide the
tools you need to extract insights effortlessly
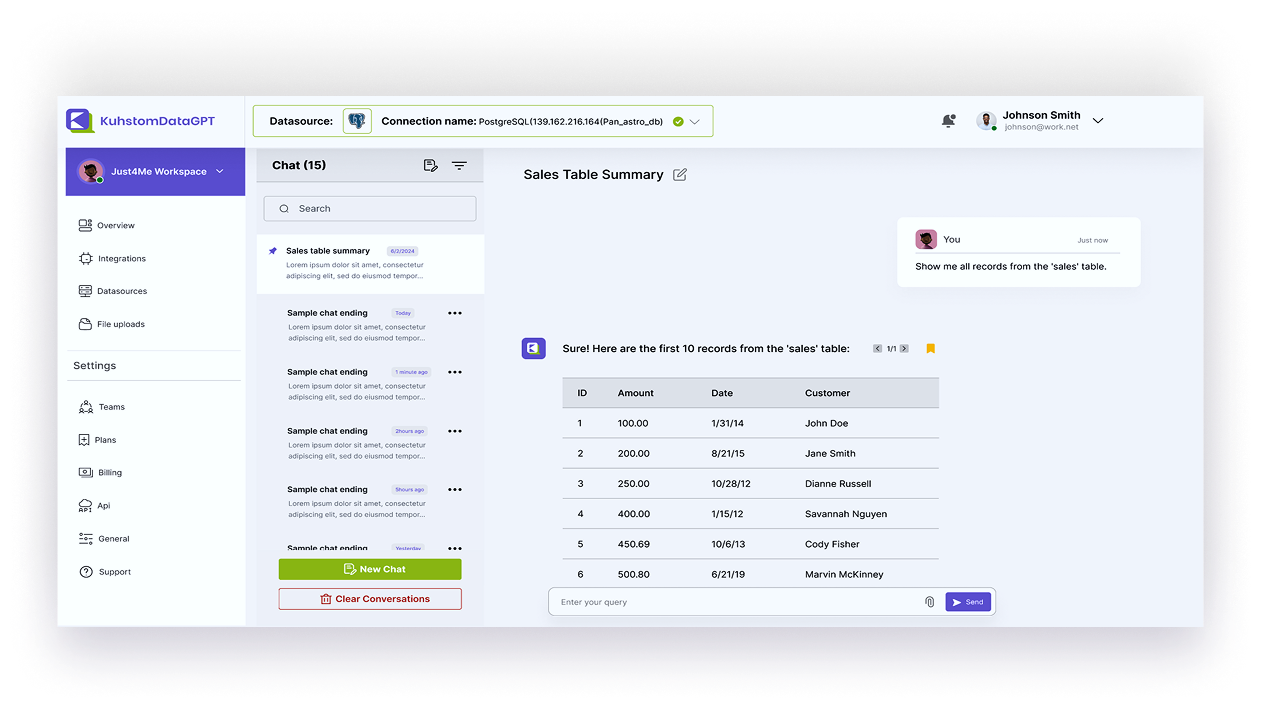
Data Sources
Easily integrate with databases, cloud storage, APIs,
and other third-party services to fetch your data in
real time.
Easily integrate with databases, cloud storage, APIs, and other third-party services to fetch your data in real time.
Integrations
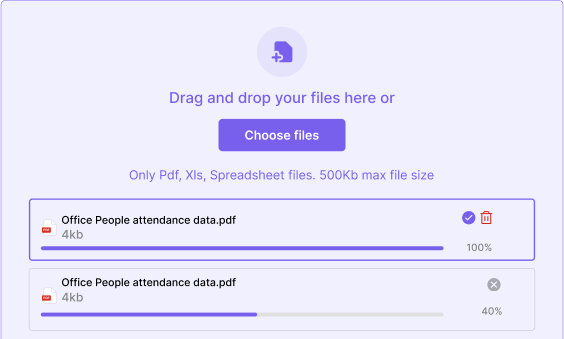
Upload & Process Your Files
Drag and drop files directly from your local storage. We support
multiple formats, including CSV, Excel, JSON, and more.
Drag and drop files directly from your local storage. We support multiple formats, including CSV, Excel, JSON, and more.
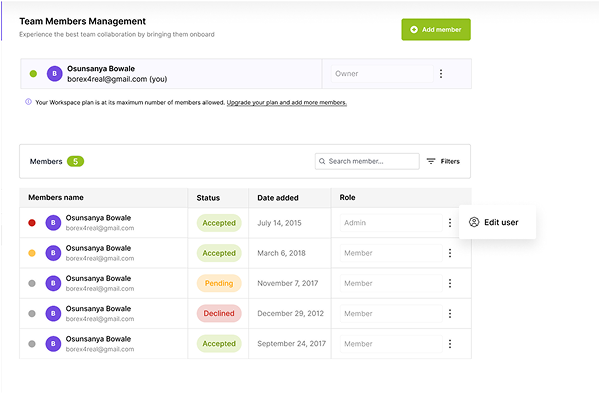
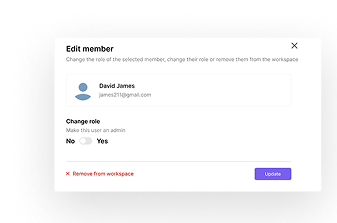
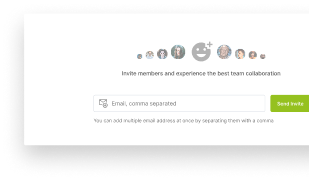
Team Invites & Role Management
Invite team members, assign roles, and
manage permissions effortlessly.
Invite team members, assign roles, and manage permissions effortlessly.

Intuitive Visualizations
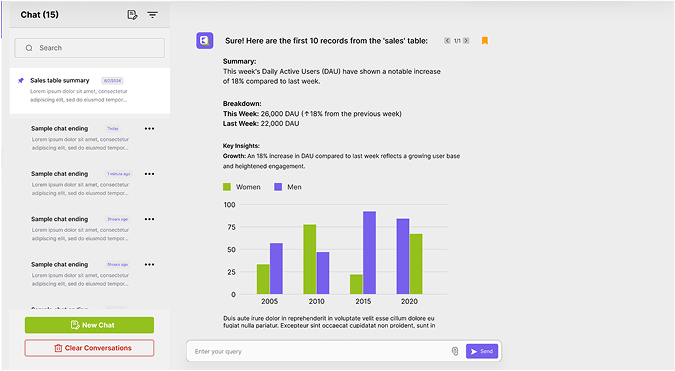
Transform raw data into stunning, interactive charts
and dashboards with just a few clicks. Choose from
a variety of visualization options, including bar
charts, line graphs, heatmaps, scatter plots, and
custom dashboards. Share insights with your team
or stakeholders in a visually compelling way, making
complex data easy to understand.
Transform raw data into stunning, interactive charts and dashboards with just a few clicks. Choose from a variety of visualization options, including bar charts, line graphs, heatmaps, scatter plots, and custom dashboards. Share insights with your team or stakeholders in a visually compelling way, making complex data easy to understand.